Business Requests and User Stories
The business request for this data analyst project was an executive sales report for sales managers. Based on the request that was made from the business following user stories were defined to fulfill delivery and ensure that acceptance criteria’s were maintained throughout the project.
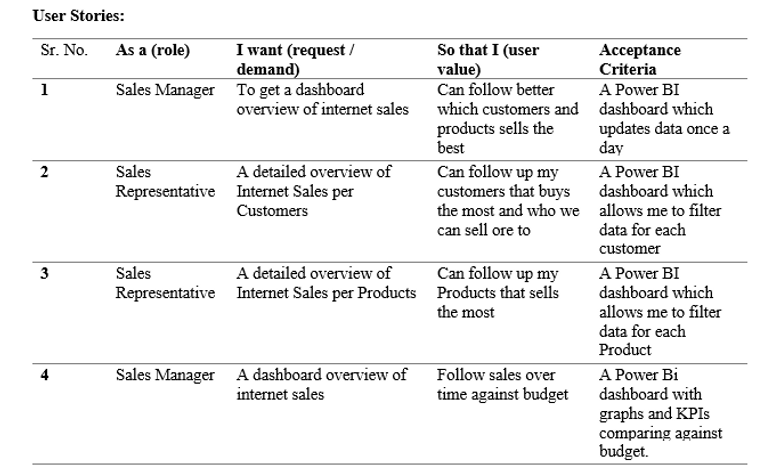
Data Cleaning & Transformation Using Sql
To create the necessary data model for doing analysis and fulfilling the business needs defined in the user stories the following tables were extracted using SQL.
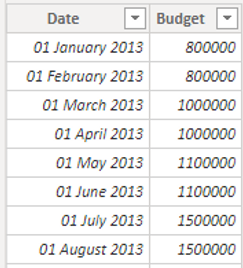
One data source (sales budgets) were provided in Excel format and were connected in the data model in a later step of the process.
Below are the SQL statements for cleansing and transforming necessary data.
Dim_Calendar :
--Cleansed Dim Date table
SELECT
[DateKey],
[FullDateAlternateKey] as [Date],
[EnglishDayNameOfWeek] as [Day],
[EnglishMonthName] as [Month],
left([EnglishMonthName], 3) as [Month_Short],
[WeekNumberOfYear] as [Week No.],
[MonthNumberOfYear] as [Month No.],
[CalendarQuarter] as [Quarter],
[CalendarYear] as [Year]
FROM
[AdventureWorksDW2019].[dbo].[DimDate]
where
[CalendarYear] >= 2010
Dim_Customer :
--Cleansed the Dim_Customer table
SELECT
c.[CustomerKey] as [CustomerKey],
c.[FirstName] as [First Name],
c.[LastName] as [Last Name],
c.[FirstName] + ' ' + [LastName] as [Full Name],
Case c.[Gender] when 'M' then 'Male' when 'F' then 'Female' end as [Gender],
c.[DateFirstPurchase] as [DateFirstPurchase],
g.[city] as [Customer City]
FROM
[AdventureWorksDW2019].[dbo].[DimCustomer] as c
left join DimGeography as g on c.GeographyKey = g.GeographyKey
order by
CustomerKey
Dim_Products :
--Cleansed Dim_Product table
SELECT
p.[ProductKey],
p.[ProductAlternateKey] as [Product item Code],
p.[EnglishProductName] as [Product Name],
ps.[EnglishProductSubcategoryName] as [Sub Category],
pc.[EnglishProductCategoryName] as [Product Category],
p.[Color] as [Product Color],
p.[Size] as [Product Size],
p.[ProductLine] as [Product Line],
p.[ModelName] as [Product Model Name],
p.[EnglishDescription] as [Product Description],
isnull(p.[Status], 'Outdated') as [Product Status]
FROM
[AdventureWorksDW2019].[dbo].[DimProduct] as p
left join DimProductSubcategory as ps on p.ProductSubcategoryKey = ps.ProductSubcategoryKey
left join DimProductCategory as pc on pc.ProductCategoryKey = ps.ProductSubcategoryKey
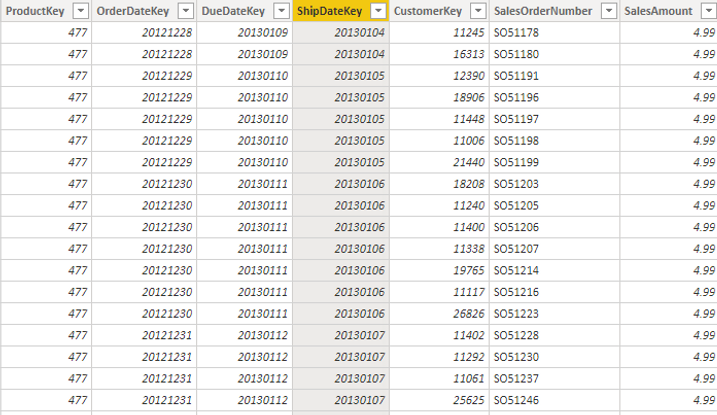
Fact_Internet Sales :
--Cleansed FACT_InternetSales Table
SELECT
[ProductKey],
[OrderDateKey],
[DueDateKey],
[ShipDateKey],
[CustomerKey],
[SalesOrderNumber],
[SalesAmount]
FROM
[AdventureWorksDW2019].[dbo].[FactInternetSales]
where
LEFT(OrderDateKey, 4)>=(2014)-2
order by
OrderDateKey
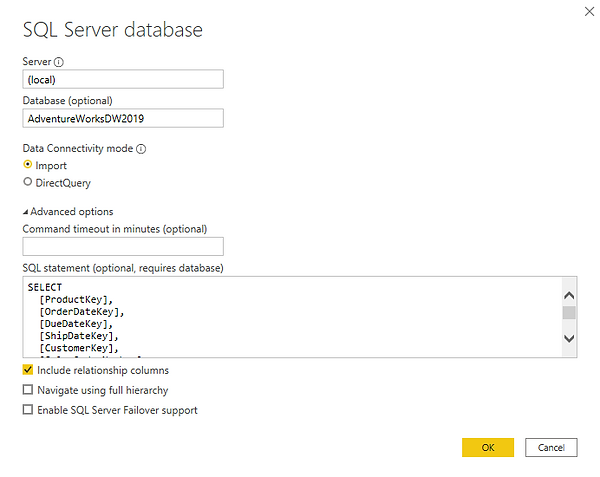
Importing Data to Power Bi Using Sql Queries
Importing Table to Power Bi with the help of Sql Queries
Data Model
Fact Sales Table and the different fields in it.

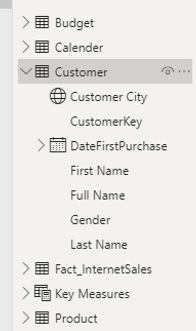
Dimension Customer table and the different fields in it.

Dimension Product table and the different fields in it.


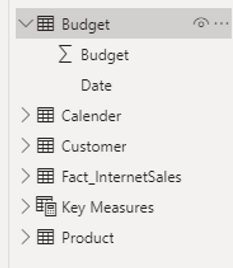
Dimension Budget table and the different fields in it.
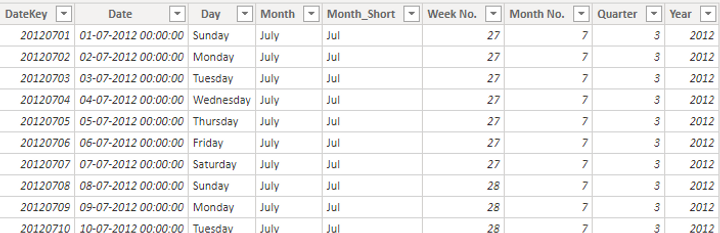
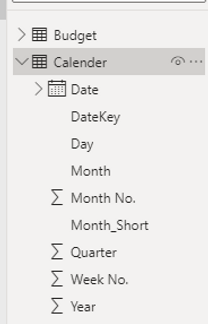
Dimension Calendar table and the different fields in it.
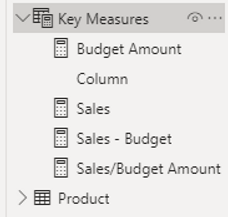
Dax(Data analysis expressions):
Here i have created a seperate table for measures. I have made several measures in this project.
Below is a screenshot of the data model created after cleaning the data.
This data model also shows how FACT_Budget has been connected to FACT_InternetSales and other necessary DIM tables.

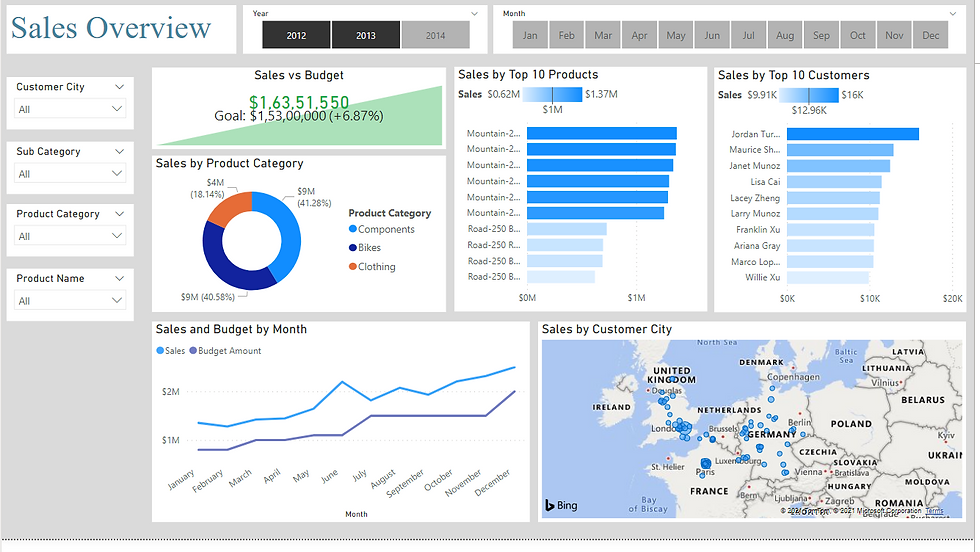
Sales Management Dashboard
The finished sales management dashboard with one page showing the Sales Overview, with two other pages focused on combining tables for necessary details and visualizations to show sales over time, per customers and per products.