


Overview and Purpose
In this Project i have worked on a dataset having data related to movies. I have downloaded this dataset from kaggle.I have done this project on Jupyter notebook using python libraries like pandas, matplotlib, seaborn numpy.
The purpose of this project is to see whether there is any correlation between the different fields.
I am considering two hypothesis:
-
Budget High Correlation with Gross
-
Company High Correlation with Gross
Importing Modules and Dataset
In this Project i have use pandas,seaborn,numpy,matplotlib

Importing movies dataset and creating a dataframe named as 'movies' using read_csv function of pandas module.
Copying the dataframe and storing it in another dataframe so my original dataframe remains safe,if something goes wrong in that case i have my original dataframe with me


Data Cleaning and Tranforming Using Pandas
Here i have spllited the column 'released' to seperate date value


Looking for any missing values in the data

Looking at the results most of the fields have null values.

Maximum null values are in budget field
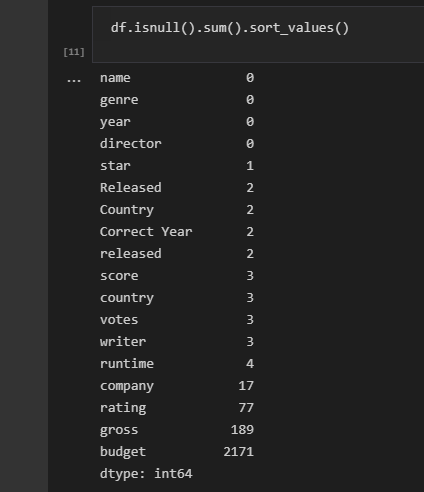
Filling null values by median values using .fillna method


Droping the irrelevent columns from the dataset

Checking if there is any missing data still left

Changing the data type

Data after Cleaning

Visualization
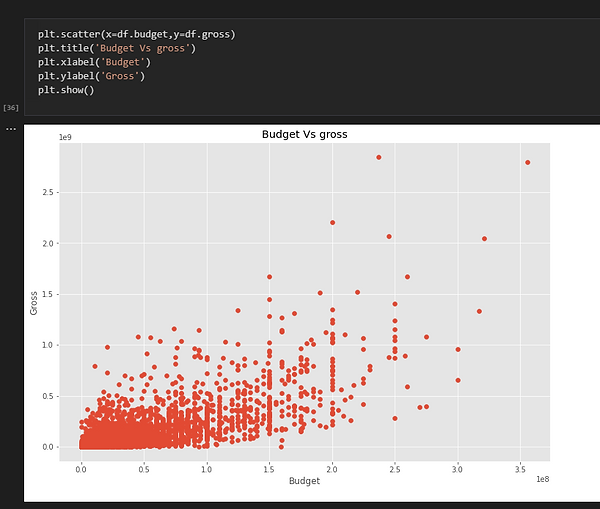
Plotting the Budget vs Gross Scatter plot using Matplotlib library to see is there any relation between Budget and Gross
Plotting the Budget vs Gross regression plot using seaborn library

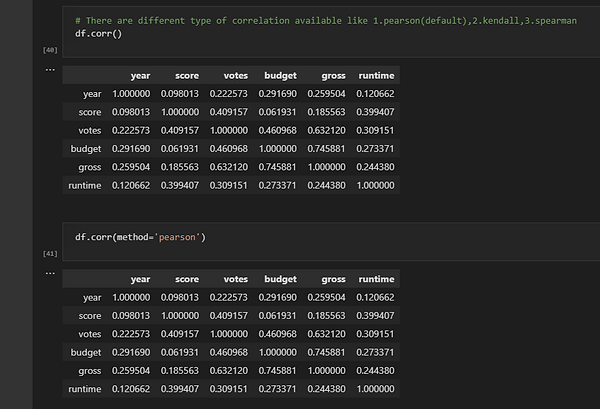
Correlation
Correlation matrix showing how the fields are correlated with each other
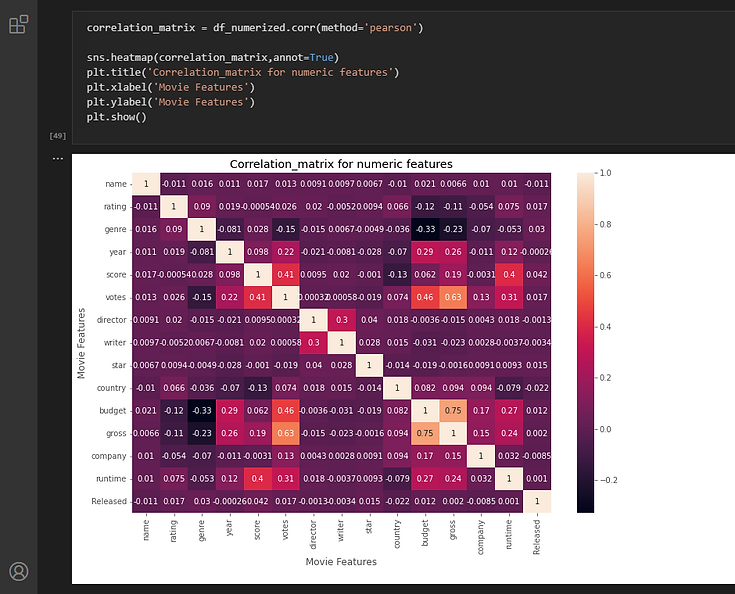
Heat map showing the correlation in the more dynamic way. It can be seen that there is high correlation between budget and gross

Converting the field having 'object' data type into 'Categorical' data type and by using cat.codes method assigning a unique code to a each category


Heat map showing correlation matrix after changing the data type


Conclusion
From the Result it can be concluded that 1 hypothesis came True and other was False.
It was seen that there was no correlation between company and gross hence this hypothesis was false.
But there was high correlation between budget and gross hence our this hypothesis came True
