Overview and Purpose
In this Project i am working on a covid 19 datasets. I have downloaded this dataset from ourworldindata.org. I have done this project using Sql and Power Bi.
The purpose of this project is to explore the data and to find useful insights out of it which satisfies the following questions.
-
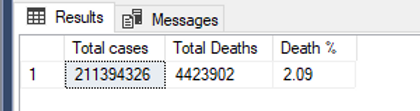
What are the total cases, total deaths, death% ?
-
Which Country has highest no. of infection ?
-
What are total deaths per continents ?
-
What is the infection trend in different countries ?
Downloading Dataset
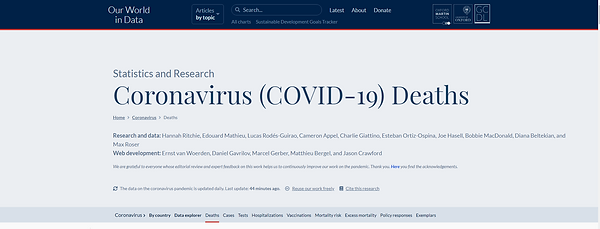
I have downloaded dataset from ourworldindata.org
To download the dataset please click on the below link
The given dataset is in .csv form so i first converted it into .xlsx format so that i can import it to sql server

Importing Dataset to Sql Server
Importing dataset using Sql Server Import and Export Wizard

Data Exploration Using Sql Queries
Download all Project related files by clicking the download button
--Looking at the dataset using sql Query
select * from Covid19_Deaths
order by 3,4
select * from [Covid19 Vaccination]
order by 3,4
--(1) select data that we are going to be using
select
[date],
[location],
[population],
total_cases,
new_cases,
cast(total_deaths as int) as [Total Deaths],
round((total_deaths / total_cases)* 100, 2) as [Death % ]
from
Covid19_Deaths
order by
2

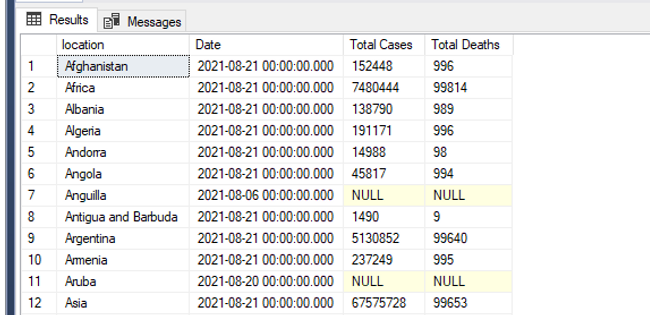
--(2) Looking at total cases vs total deaths
select
[location],
max([date]) as [Date],
max(total_cases) as [Total Cases],
max(total_deaths) as [Total Deaths]
from
Covid19_Deaths
group by
[location]
order by
1,
2
--(3) Looking Total cases vs Population
--shows what % of population got covid
select
[location],
[date],
[population],
total_cases,
round((total_cases / [population])* 100,2) as [ % Infected Population]
from
Covid19_Deaths
where
[continent] is not null
order by
1,
2

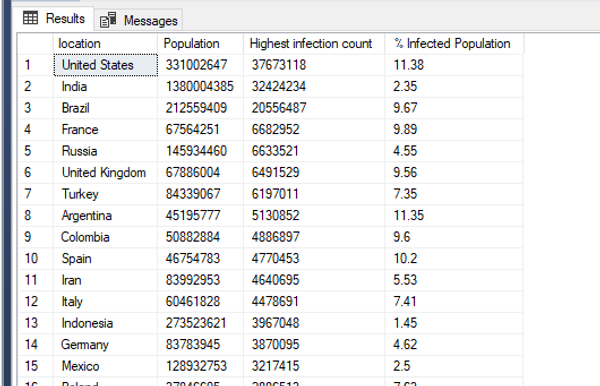
--looking at countries with highest infection rate compared to population
select
[location],
max([population]) as [Population],
max(total_cases) as [Highest infection count],
max(round((total_cases / [population])* 100,2)) as [ % Infected Population]
from
Covid19_Deaths
where
[continent] is not null
group by
[location]
order by
3 desc
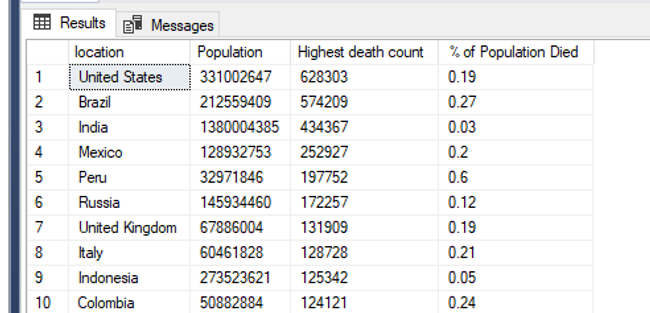
--Showing countries highest death count per population
select
[location],
max([population]) as [Population],
max(cast(total_deaths as int)) as [Highest death count],
max(round((total_deaths / [population])* 100, 2)) as [ % of Population Died]
from
Covid19_Deaths
where
[continent] is not null
group by
[location]
order by
3 desc
--(5) Global Numbers
with GlobalNumbers ([location], [Total cases], [Total Deaths]) as (
select
[location],
max([total_cases]) as [Total cases],
max(cast([total_deaths] as int)) as [Total Deaths]
from
Covid19_Deaths
where
[continent] is not null
group by
[location]
)
select
sum([Total cases]) as [Total cases],
sum([Total Deaths]) as [Total Deaths],
round((sum(cast([Total Deaths] as int))/ sum([Total cases]))* 100, 2) as [Death % ]
from
GlobalNumbers
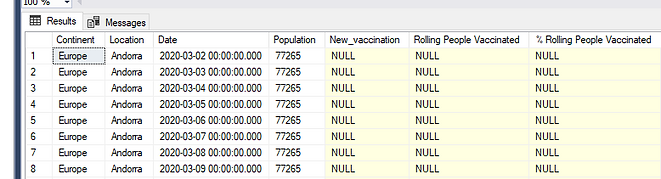
--CTE(Common Table Expression) takes the result of an query as an reference
--Using CTE for doing rolling summation on vaccination field
with PopvsVac (
Continent, [Location], [Date], [Population], [New_vaccination], [Rolling People Vaccinated]) as(
select
d.continent,
d.[location],
d.[date],
d.[population],
v.new_vaccinations,
SUM(convert(int, v.new_vaccinations)) over (partition by d.[location]
order by
d.[location],
d.[date]
) as [Rolling People Vaccinated]
from
[Covid19_Deaths] as d
join [Covid19 Vaccination] as v on d.[location] = v.[location]
and d.[date] = v.[date]
where
d.[continent] is not null
)
select *, round(([Rolling People Vaccinated] / [Population])* 100,2) as [ % Rolling People Vaccinated]
from
PopvsVac
--Using Temporary Table
--Using Temp Table for doing rolling summation on vaccination field
drop table if exists PopsvsVac
create table PopsvsVac (
Continent nvarchar(255),
[Location] nvarchar(255),
[Date] datetime,
[Population] numeric,
[New_vaccination] numeric,
[Rolling People Vaccinated] numeric
)
insert into PopsvsVac
select
d.continent,
d.[location],
d.[date],
d.[population],
v.new_vaccinations,
SUM(convert(int, v.new_vaccinations)) over (partition by d.[location]
order by
d.[location],
d.[date]
) as [Rolling People Vaccinated]
from
[Covid19_Deaths] as d
join [Covid19 Vaccination] as v on d.[location] = v.[location]
and d.[date] = v.[date]
where
d.[continent] is not null
select *, round(([Rolling People Vaccinated] / [Population])* 100,1) as [ % Rolling People Vaccinated]
from
PopsvsVac
--Creating View of table
create view vwPopvsVac as
select
d.continent,
d.[location],
d.[date],
d.[population],
v.new_vaccinations,
SUM(convert(int, v.new_vaccinations)) over (partition by d.[location]
order by
d.[location],
d.[date]
) as [Rolling People Vaccinated]
from
[Covid19_Deaths] as d
join [Covid19 Vaccination] as v on d.[location] = v.[location]
and d.[date] = v.[date]
where
d.[continent] is not null
select * from vwPopvsVac

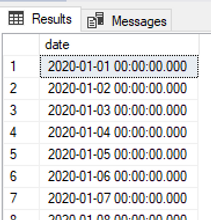
-- Calender with distinct dates to be use in Data Visualization
select
[date]
from
Covid19_Deaths
group by
[date]
order by
1
--Continents and Location table to be use in Data Visualization
select
c.[continent],
l.[location]
from
Covid19_Deaths c
join Covid19_Deaths l on c.continent = l.continent
and c.[location] = l.[location]
group by
c.[continent],
l.[location]
order by
1

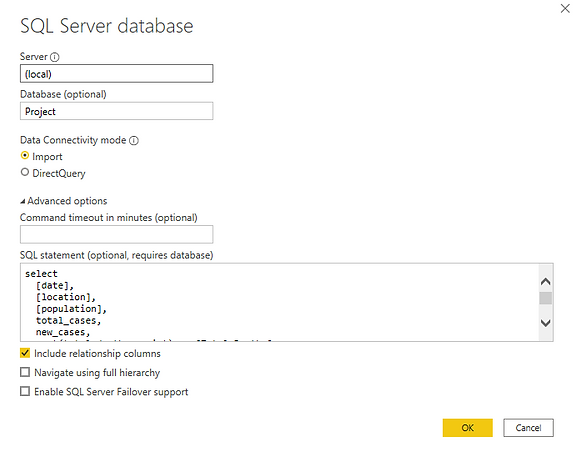
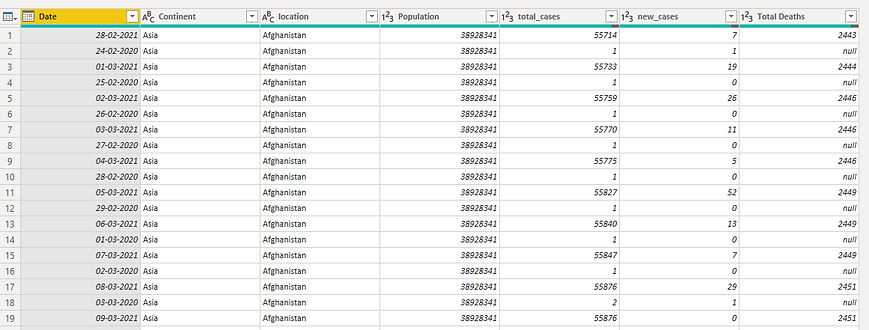
Importing Data to Power Bi Using Sql Queries
Importing Table to Power Bi with the help of Sql Queries
Data Cleaning using Power Query
Here i have 3 tables Actual data, Continent & Location table and Calender table. These tables is grouped into two types one as fact table and other as dimension tables. Here Actual data is our fact table and other two is our dimension tables

Different operation performed on fact table

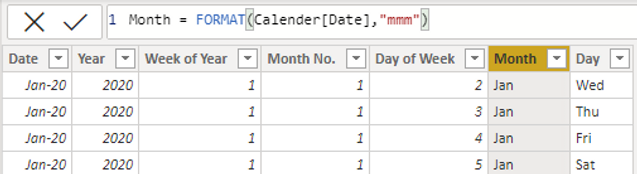
Different operation performed on Calender Table


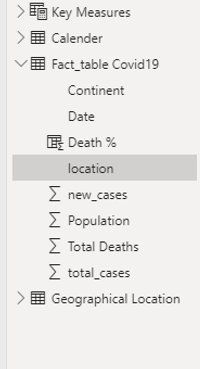
Data Model
Fact Table and the different fields in it. Here Death % is a Calculated Column

Calender Table and the different fields in it. Here Day and Month are Calculated Columns


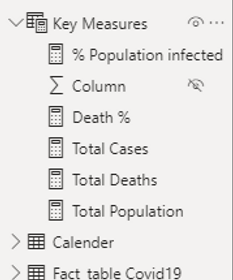
Dax(Data analysis expressions):
Here i have created a seperate table for measures. I have made several measures in this project.I have also made some calculated columns that i have mentioned in above tables.
-
Measures

-
Calculated Columns