top of page

Book  Store Project

Business Requests and User Stories

The business request for this data analyst project was an executive sales report for book store owner. Based on the request that was made from the business following user stories were defined to fulfill delivery and ensure that acceptance criteria’s were maintained throughout the project.
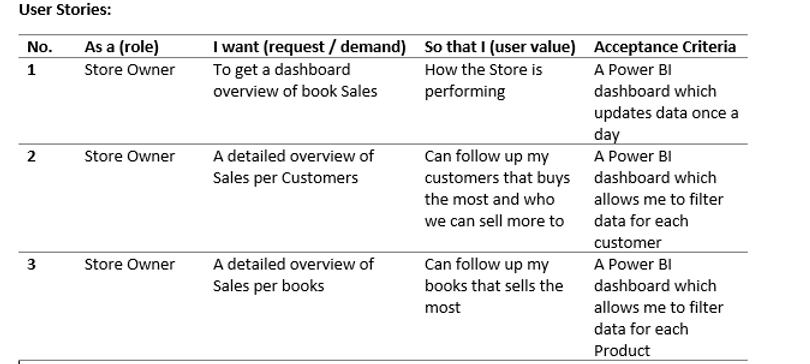
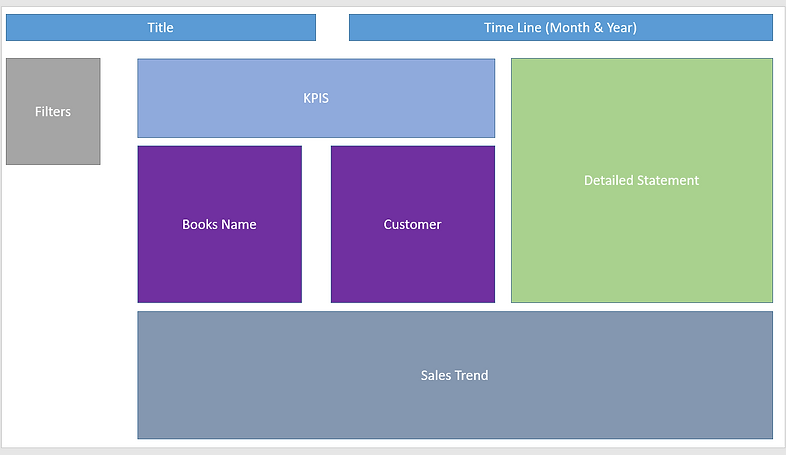
Business Demand.png

Dataset

This Project is based on the dataset of a book store. I have downloaded the dataset from the internet. To download the dataset click on the download button given below

  • Product Table

Dim Product Table.png
  • Sales Table

Fact Sales.png

Dashboard Overview

I have made a outline of the dashboard according to the needs of the store owner 

Dashboard Overview.png

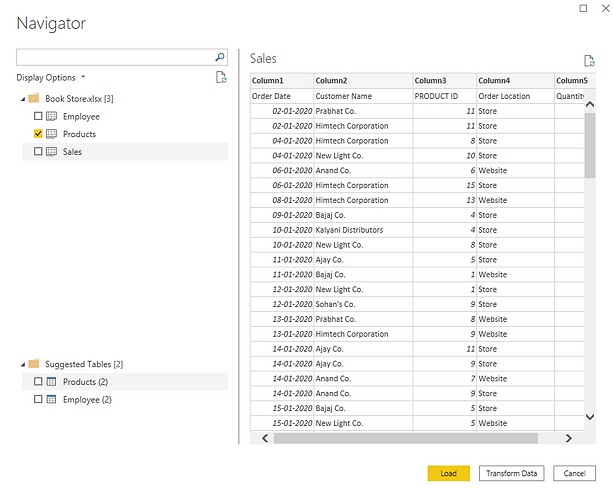
Importing Data to Power Bi

Importing Table to Power Bi

Importing Data.png

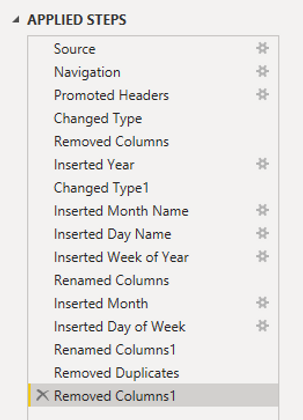
Data Cleaning using Power Query

Here i have 3 tables Sales table, Product and Calendar table. These tables are grouped into two types one as fact table and other as dimension tables. Here Sales data is our fact table and other two are our dimension tables

Fact and Dimension Tables.png

Different operation performed on fact Sales table

Operation Performed on Fact Sales Table.png
Fact Sales table Cleaning.png

Different operation performed on Product Table

Operation Performed on Product Table.png
Product table Cleaning.png

Different operation performed on Calendar Table

Operation Performed on Calender Table.png
Calender Table Cleaning.png

Data Model

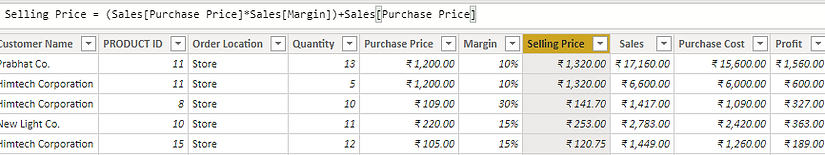
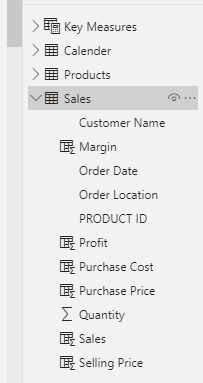
Fact Sales Table and the different fields in it. Here Margin %, Profit, Purchase Cost Purchase Price, Selling Price, Sales are Calculated Columns

Fact Sales Fields.png
Data Model Fact Sales.png

Dimension Product Table and the different fields in it.

Data Model Product Table.png
Products Fields.png

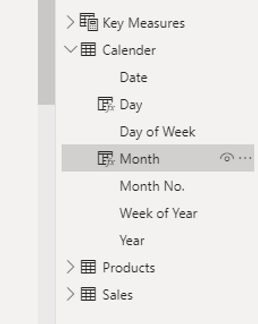
Dimension Calendar Table and the different fields in it.

Data Model Calender.png
Calender Fields.png

Dax(Data analysis expressions):

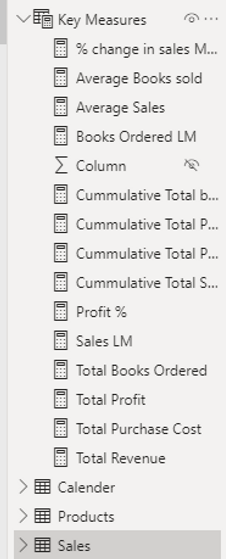
Here i have created a seperate table for measures. I have made several measures in this project.I have also made some calculated columns that i have mentioned in above tables.

  • Measures

Measures.png
Measure Change in Sales MOM.png
Measure Books Ordered last Month.png
Measure Cummulative Total Sales.png
Measure Cummulative Total Purchase Cost.png
Measure Profit %.png
Measure Sales Last Month.png
Measure Total Books Ordered.png
Measure Total Profit.png
Measure Total Purchase Cost.png
Measure Total Sales.png
  • Calculated Columns

Calculated Column Fact Sales Purchase Price.png
Calculated Column Fact Sales Purchase Cost.png
Calculated Column Fact Sales  Sales.png
Calculated Column Fact Sales  Selling Price.png
Calculated Column Fact Sales  Margin.png
Calculated Column Fact Sales Profit.png
Calculated Column Calender Day.png
Data Model.png

Dashboard

The finished dashboard with one page showing the Sales Overview, Other two pages showing details regarding books and customer.

To download the require file click on download button

bottom of page